Using rrdtool to chart Indigo data
Indigo currently shipping version 7 is a leading Mac home automation software package. One of it’s mostly widely-used features is its ability to execute user-provided Python scripts of AppleScripts. In my previous introduction to scripting Indigo with Python I showed how to use the Indigo plugin host to execute Python scripts. In this post, I’ll describe how I use a third-party charting package rrdtool to graph data from Indigo by taking advantage of Indigo’s ability to execute arbitrary Python scripts. This tutorial is focused on using Python as a bridge between Indigo 7 and rrdtool. If you are interested in a solution that takes advantage of AppleScript and bash scripts to do the samee thing, see this thread on the Indigo forums.
Installing rrdtool
I used Homebrew to install rrdtool. Homebrew is a package manager for macOS. If you already have Homebrew, then installing rrdtool is just: brew install rrdtool. Otherwise, you can easily install Homebrew. In the terminal, execute the following:
/usr/bin/ruby -e "$(curl -fsSL \
    https://raw.githubusercontent.com/Homebrew/install/master/install)"
After installing Homebrew, then you can easily install rrdtool as described above.
Installing Python bindings for rrdtool
While it’s possible to run rrdtool from ApplesScripts that are executed inside of Indigo, it may be preferrable to use Python. I’ve found Python much easier to work with and more reliable than AppleScript. If you use Python, then the bindings to rrdtool make the work much easier than setting up shell scripts to execute. To install the Python bindings, I used sudo easy_install rrdtool. That should take care of all the prerequisites and install the rrdtool Python module.
Briefly introducing rrdtool
This tutorial isn’t meant to be an exhaustive introduction to rrdtool, but I’ll briefly describe the principles of operation. As its name implies, rrdtool uses a round robin database format which is a time series storage format implemented as a circular list. This format allows us to look closely at short-term trends while losing precision over the longer term. It’s ideal and compact for examining short-term data trends. rrdtool then is a set of tools that manage and graph data from a round robin database.
Creating a round robin database
To get started using rrdtool you need to create a database that will hold the data that Indigo 7 provides from your sensors. In my first use case, I was interested in charting temperature and humidity levels in a part of my basement. I set up the database as follows:
rrdtool create /usr/local/share/obasement.rrd
--step 90 \
DS:temperature:GAUGE:2000:32:80 \
DS:humidity:GAUGE:2000:20:80 \
RRA:AVERAGE:0.5:1:350400 \
RRA:AVERAGE:0.5:96:3650 \
RRA:MIN:0.5:96:3650 \
RRA:MAX:0.5:96:3650
This asks rrdtool to create a new database as the specified location with the name obasement.rrd. The parameter descriptions are beyond the scope of this tutorial but briefly, the DS parameter has the following format: DS:variable_name:DST:heartbeat:min:max. The DST is the Data Source Type which can be any of: COUNTER, DERIVE, ABSOLUTE, GAUGE. Here, the GAUGE value for DST just means that no rate of change is saved - only the primary data point. The next parameter of DS is the heartbeat. To simplify, you can look at the heartbeat as the interval seconds between expected data points. Finally we have the expected minimum and maximum values for the data.
The RRA parameters specify a round robin archive and describes the behaviour of the consolidation algorithm. A round robin database has to compress older data to maintain its circular compact list and the RRA parameters describe how that should work. Here we’re using an AVERAGE function to consolidate old data.
I’d recommend reading through this thorough introduction to the rrd format parameters before creating your own databases.
Obtaining data from sensors via Indigo
In this example case, I want to chart temperature and humidity levels from a Aeotec MultiSensor 6. Grabbing the values from this device via Python is easy:
import rrdtool

# "Original basement temperature sensor"
temp = indigo.devices[401767099].sensorValue
# "Original basement humidity"
hum = indigo.devices[1437240536].sensorValue

# update our round robin database
rrdtool.update('/usr/local/share/obasement.rrd','N:{0}:{1}'.format(temp,hum))
In line 9, we update the round robin database with the incoming data. This script can be launched from and Indigo schedule that corresponds to the heartbeat we specified.
Graphing our data
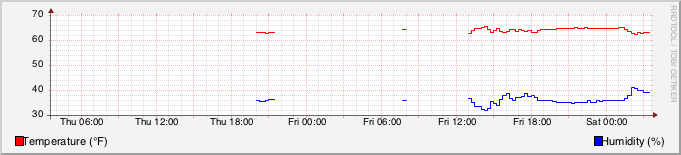
Generating graphs of the data is straightforward now that we have the database functioning. Here’s the code that generates my graphs:
ret = rrdtool.graph("/Users/alan/Desktop/obasement.png",
    "--start", "-2days", "-w 600",
    'DEF:Humidity=/usr/local/share/obasement.rrd:humidity:AVERAGE',
    'DEF:Temperature=/usr/local/share/obasement.rrd:temperature:AVERAGE',
    'LINE1:Temperature#ff0000:Temperature (°F)',
    'LINE1:Humidity#0000ff:Humidity (%)'
)
The full update-and-graph script is here:
Here you have a few choices, you can schedule the update and graph generation as a scheduled task in Indigo, or you can schedule it in the OS. I chose the latter and used the application LaunchControl to launch the job as a User Agent at the interval specified by the heartbeat parameter. The program to run in LaunchControl is: "/Library/Application Support/Perceptive Automation/Indigo 7/IndigoPluginHost.app/Contents/MacOS/IndigoPluginHost" -x /Users/alan/Documents/dev/scripts+tools/indigo_graph_obasement.py or “path-to-indigo-plugin-host -x path-to-my-script”
The result
The result of all of this is a graph of the temperature and humidity in my basement which I can incorporate in control pages or display anywhere else of my choosing.
Of course, to use the graph in your Indigo control pages, you’ll need to change the path in the above code to “/Library/Application Support/Perceptive Automation/Indigo 7/IndigoWebServer/images”.
Acknowledgements
The inspiration to write this implementation came from users cullenfluffyjennings and webdeck in this thread on the Indigo forums.
See also
- rrdgraph (1) man page
- rrd_graph examples
- Python/rrdtool tutorial
- Python rrdtool bindings documentation
- Indigo 7 scripting tutorial
- A more thorough description of round robin databases
- Indigo 7 devices reference
- RRD for beginners
- MRTG and RRD implementation using AppleScript - this is the Indigo forums post that inspired me to rewrite it in Python.